Everybody knows that inequality has been rising in New Zealand since the time the term was invented. We know this because the commentariat tell us so. They tell us often:
The last few years have shown a sharp rise in the number of newspaper articles devoted to inequality. … Inequality is clearly seen as a serious and rising problem. The only problem with that is that the data says otherwise.
What’s that?
Work by both the Ministry for Social Development and Treasury shows that while inequality rose through the reforms of the late 80s and early 90s, it since plateaued or even dropped. The Ministry of Social Development concluded that there has been no rise or fall in income inequality in the last twenty years across a range of measures.
Treasury work by Christopher Ball and John Creedy found, in addition to a mild decline in Gini measures of income inequality since 2001, there has been substantial reduction in consumption inequality. Inequality in consumption has, since 2010, been rising mildly, but is currently below 1984’s level.
Let’s just repeat those last points. :
- Across a range of measures, there has been no rise or fall in income inequality in the last twenty years
- Inequality measured by consumption is currently below 1984’s level
- There has been a mild decline in income inequality since 2001
Yet as inequality has either flattened or declined, media conversations about rising inequality has exploded – as the graph below comparing media mentions with the actual data. Clearly, their campaigning against rising inequality may be motivated by many things, but one of them is not the evidence …

Seeing a campaign dissolve before his eyes, inequality campaigner Max Rashbrooke has felt compelled to challenge them. Editor of a book claiming an "explosion in the rich-poor divide during the last 30 years," Rashbrooke leapt into print in the DomPost yesterday to say Despite what you hear, inequality has risen in New Zealand.
Max begins by agreeing with the figures on income inequality:
The New Zealand Initiative's claim that there is no problem is based on a Treasury paper showing that income inequality has been stable for the last decade. And indeed it has … But what this selective reading omits is the fact that in the two decades from the mid-1980s on, the rich-poor divide widened faster in New Zealand than in any other developed country.
Stable but widening fast. Square that circle any way you like. Max doesn’t even try to. Instead, he turns his guns on consumption inequality. It is just not a useful measure, he says:
None of the major OECD, IMF or World Bank reports uses this consumption measure, nor do any of the key international thinkers on inequality. Taking it seriously – and thus discounting the reality of inequality in this country – risks turning New Zealand's attention away from the crucial international conversation about widened income divides.
Nice try at turning away the local conversation from local evidence showing the opposite, Max.
Here’s some advice on challenging data. You’re free to challenge the methods of measurement, like Max challenging the measure of consumption inequality. But you are not free to make up your own.
Because assuming the consequent, Max then rushes off to say that in our system of rising inequality
The result is a doubling of child poverty …
Neither conclusion nor connection is sound.
Welfare researcher Lindsay Mitchell is very good at spotting these errors. She virtually does it for a living:

Child poverty is a terrible thing. Inequality is said to be one. But where would campaigners against both be if their problem was being solved? If they deny the improvements in what they say are their concerns, are we entitled to wonder if their campaigning on these issues is perhaps a proxy for something else?
RELATED POSTS:
- Inequality Myths
- Poverty?
- Inequality "is an inherent feature of the market economy."
- How Modern Money Production Worsens Income Inequality
UPDATE: Responding to “veteran grumbler” Max Rashbrooke, Jim Rose gabs some of the loving detail compiled every year by Brian Perry for the Ministry Who Concerns Themselves With This Sort of Thing. Key graph on child poverty is this one:
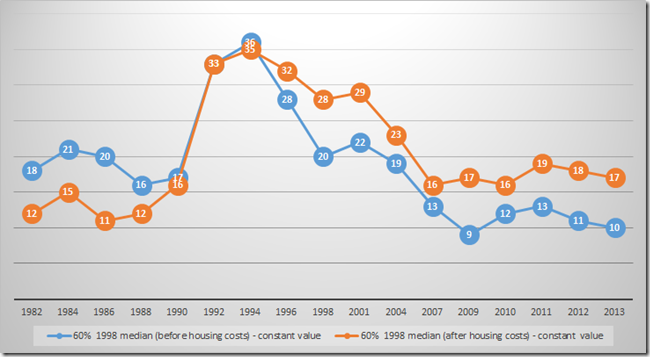
Figure 1: child poverty in New Zealand (before and after housing costs), 1982 – 2013
Even the uninsightful observer can see the huge impact of housing costs on past and present figures, about which Jim has much more. Remembering however that the poverty measure is a relative one, that same uninsightful observer might appreciate however that things increased badly in the early-1990s recession before beginning a gradual decline – one that was halted, wouldn’t you know i, by the introduction of the ironically labelled “Working For Families” in 2005. Ironic, because it clearly hasn’t been.
Jim Rose’s conclusion, supported by tight argument and several more facts and figures, is that” Labour and the Greens are in effect keeping the poor poor to win middle-class votes.” (I imagine he’s only leaving out National, who left in Labour’s Working For Families, for form’s sake.)
2 comments:
The fact that I DON"T do it for a living hopefully encourages greater objectivity and impartiality:-)
Thanks for the plug.
Hey, thanks for doing so much that's worth plugging.
Post a Comment